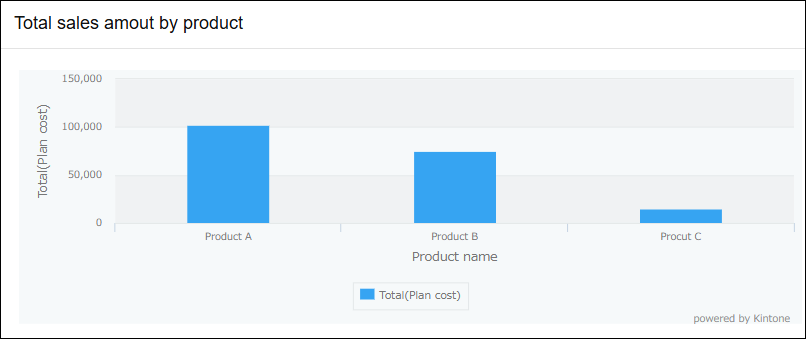
วิด กราฟ
วิดเจ็ต กราฟ ใช้เพื่อแสดงกราฟจากแอปที่ระบุบนพอร์ทัลของคุณ
การแสดงภาพเปอร์เซ็นต์และการเปลี่ยนแปลงในข้อมูลของคุณช่วยให้ผู้ใช้เข้าใจแนวโน้มและรูปแบบได้อย่างรวดเร็ว นอกจากนี้ยังช่วยให้สังเกตเห็นการเปลี่ยนแปลงที่สําคัญในข้อมูลของคุณได้ง่ายขึ้น รวมถึงการเพิ่มและลดลงที่ต้องให้ความสนใจ
วิดเจ็ กราฟ มักใช้เพื่อ:
- แสดงภาพแนวโน้มการขายและติดตามประสิทธิภาพในช่วงเวลาต่างๆ
- แสดงระดับสต๊อกคงเหลือในกราฟเพื่อแชร์สถานะปัจจุบันกับทีมของคุณ
การตั้งค่าวิดเจ็ กราฟ
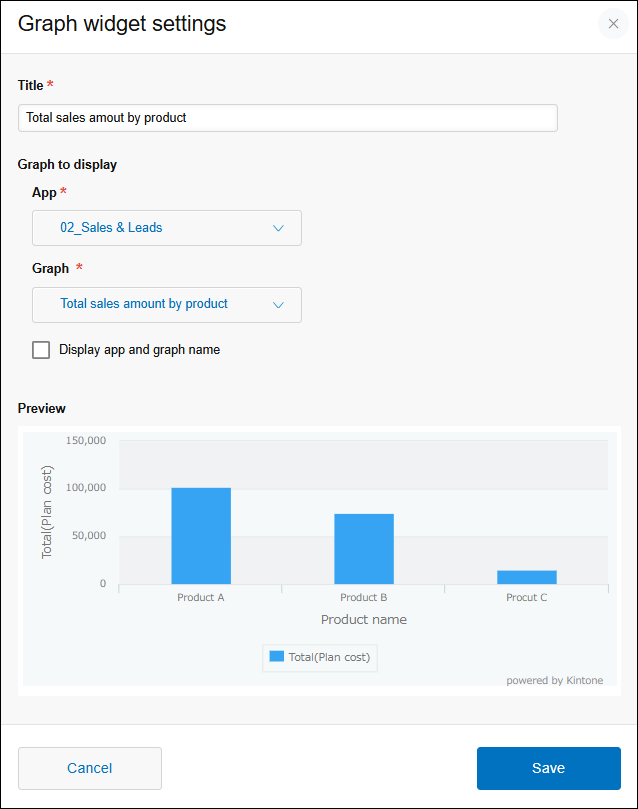
ชื่อเรื่อง
ป้อนชื่อที่จะแสดงบนวิดเจ็ต
มาตรฐาน ชื่อเรื่อง ต้องกรอกข้อมูลในช่องนี้ คุณสามารถกรอกได้สูงสุด 128 ตัวอักษร
กราฟ ที่จะแสดง
คุณต้องเลือกการตั้งค่า แอพ และ กราฟ
ถ้าคุณต้องการแสดงชื่อของกราฟและแอปที่เป็นของกราฟ ให้เลือกกล่องกาเครื่องหมาย ชื่อที่แสดง ของแอปและกราฟ
แอป
คลิกรายการดรอปดาวน์และค้นหาแอป จากนั้นเลือกแอปที่คุณต้องการระบุจากคําแนะนําการค้นหา
โปรดทราบว่าเฉพาะแอปที่คุณมีสิทธิ์ดูเท่านั้นที่จะรวมอยู่ในคําแนะนํา นอกจากนี้ คําแนะนําการค้นหาจะไม่รวมแอปที่เป็นของพื้นที่ทํางานสําหรับแขก
คําแนะนํา ค้นหา จะแสดงแอปจากมากไปหาน้อยตามวันที่สร้าง
กราฟ
คลิกรายการดรอปดาวน์และเลือกกราฟที่จะแสดง
พรีวิว
เมื่อคุณกำหนดค่าการตั้งค่าทั้งหมดภายใต้ กราฟ ให้แสดงแล้ว ตัวอย่างจะปรากฏขึ้น