เป็นไปได้ไหมที่จะสร้างแผนภูมิ (หรือทำการคำนวณเพิ่มเติม) โดยอิงจากผลรวมทั้งหมด
ฟีเจอร์การรวมแผนภูมิและข้อมูลไม่สามารถทำการรวมข้อมูลรองกับผลลัพธ์ที่รวมไว้แล้วได้ ตัวอย่างเช่น คุณไม่สามารถคำนวณสัดส่วนของค่ากับค่าฟิลด์บางค่าที่รวมไว้ก่อนหน้านี้ได้
อย่างไรก็ตาม หากคุณต้องการแสดงยอดขายรวมและอัตราความสำเร็จบนหน้าจอเดียวกัน คุณสามารถวางช่องสำหรับยอดขาย จำนวนเป้าหมาย และอัตราความสำเร็จบนแบบฟอร์มตามลำดับ จากนั้นคำนวณ "ผลรวม" สำหรับยอดขายและอัตราความสำเร็จ และคำนวณ "ค่าเฉลี่ย" สำหรับจำนวนเป้าหมาย
ในกรณีนี้ เราขอแนะนำให้ใช้รูปแบบตารางแทนแผนภูมิแท่ง เนื่องจากความแตกต่างอย่างมีนัยสำคัญในจำนวนหลักระหว่างอัตราความสำเร็จและยอดขาย ทำให้ยากต่อการอ่านอัตราที่คำนวณได้บนแผนภูมิแท่ง
ตัวอย่างการตั้งค่า
การตั้งค่า แบบฟอร์ม
เพิ่มฟิลด์ต่อไปนี้ลงในแบบฟอร์มของแอป:
- ช่อง วันที่
- ชื่อฟิลด์: วันที่
- รหัสฟิลด์ : วันที่
- ฟิลด์ ตัวเลือกผู้ใช้งาน
- ชื่อฟิลด์: ชื่อ ผู้ติดต่อ
- รหัสฟิลด์ : Contact_Name
- ช่อง จำนวน
- ชื่อฟิลด์: จำนวนเงิน เป้าหมาย รายเดือน
- รหัสฟิลด์: Monthly_Target_Amount
- ช่อง จำนวน
- ชื่อฟิลด์: ยอดขาย
- รหัสฟิลด์: Sales_Amount
- ฟิลด์ ผลคำนวณ
- ชื่อฟิลด์: อัตราความสำเร็จ
- รหัสฟิลด์: อัตราความสำเร็จ
- สูตร: Sales_Amount / Monthly_Target_Amount * 100
- หน่วยวัด: % (คำต่อท้าย)
การตั้งค่า กราฟ
กำหนดค่าแผนภูมิสำหรับการคำนวณ คุณสามารถระบุชื่อแผนภูมิได้
ดูที่ การสร้างแผนภูมิบนหน้าจอ "การตั้งค่าแอป"
- ประเภทแผนภูมิ: ตาราง
- จัดกลุ่มตาม
- ระดับที่ 1: วันที่ ตามเดือน
- ระดับที่ 2: ชื่อ ผู้ติดต่อ
- ฟังก์ชัน
- ค่าเฉลี่ย: จำนวนเงิน เป้าหมาย รายเดือน
- ผลรวม: ยอดขาย
- ผลรวม: อัตราความสำเร็จ
- ตัวกรอง: เร็คคอร์ดทั้งหมด
- จัดเรียงตาม: ระดับที่ 1, เรียงจากน้อยไปมาก
บันทึก ที่จะเพิ่ม
เพิ่มรายการต่อไปนี้:
| วันที่ | ชื่อ ผู้ติดต่อ | จำนวนเงิน เป้าหมาย รายเดือน | ยอดขาย | อัตราความสำเร็จ |
|---|---|---|---|---|
| 2021-07-01 | เอ | 300000 | 20000 | 6.67% |
| 2021-07-08 | เอ | 300000 | 15000 | 5% |
| 2021-07-12 | เอ | 300000 | 30000 | 10% |
| 2021-07-05 | บี | 250000 | 10000 | 4% |
| 2021-07-15 | บี | 250000 | 50000 | 20% |
ข้อมูลบันทึกรวม
ตรวจสอบผลรวม
อ้างถึง การสร้างแผนภูมิ
| วันที่ (รายเดือน) | ชื่อ ผู้ติดต่อ | ค่าเฉลี่ย (จำนวน เป้าหมาย รายเดือน) | ผลรวม (ยอดขาย) | ผลรวม (อัตราความสำเร็จ) |
|---|---|---|---|---|
| 2021-07-01 | บี | 250000 | 60000 | 24% |
| 2021-07-01 | เอ | 300000 | 65000 | 21.67% |
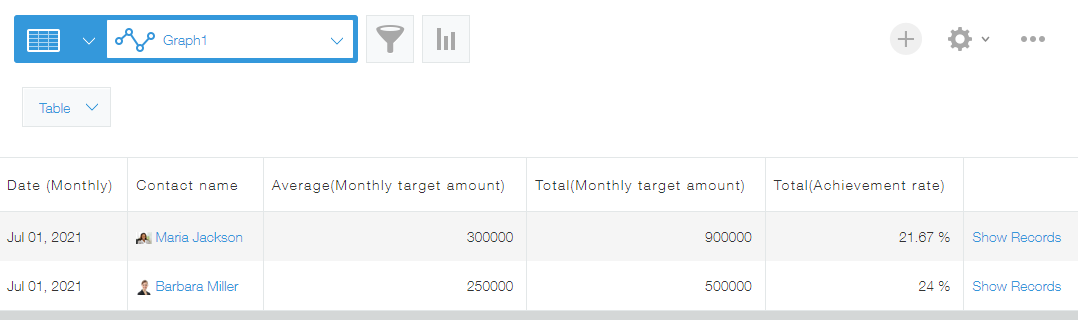
ด้วยวิธีการนี้ คุณสามารถแสดงยอดขายและอัตราความสำเร็จบนหน้าจอเดียวกันได้