What is a chart?
You can use the chart feature to configure conditions for performing data aggregation on the total number of numerical values, the number of records, and so on.
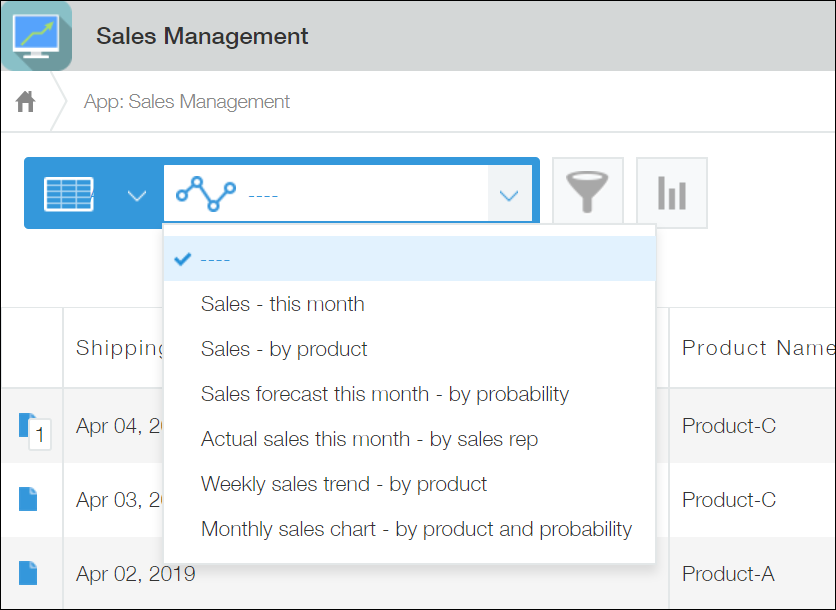
To display a chart that you've created, click the chart button on the View screen of an app and select the chart from the drop-down list.
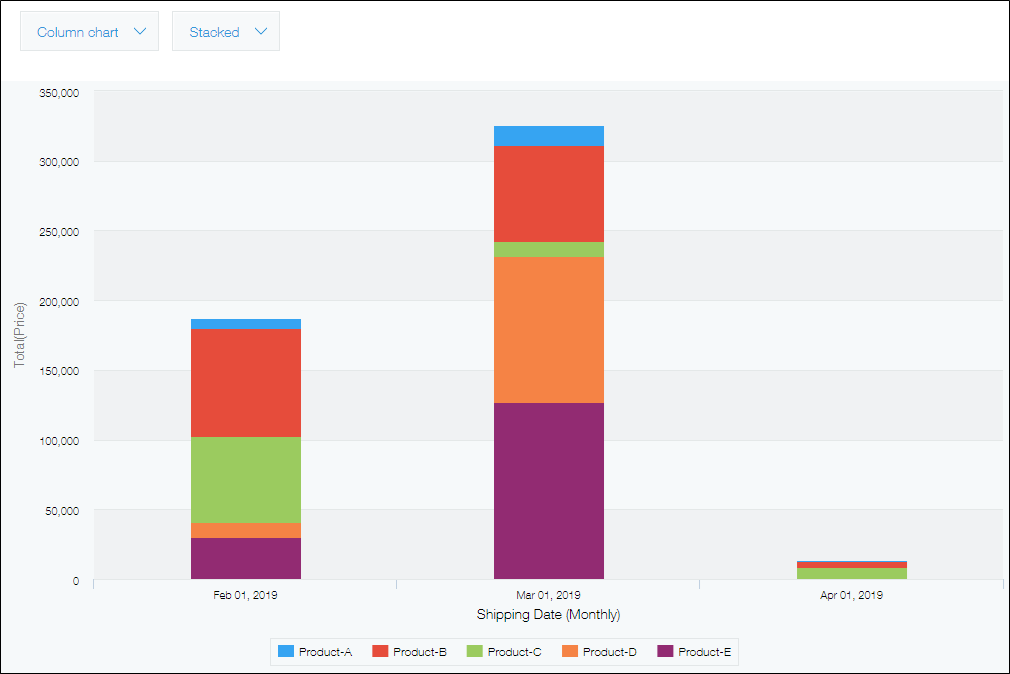
When a chart is selected from the drop-down list, the aggregation conditions set for the app are applied. The aggregated result is then displayed in a graph or table format.