What are periodic reports?
The Periodic Reports feature periodically aggregates app data and logs the results. App data is aggregated and logged at regular intervals, such as hourly, daily, or monthly.
You can check the logged results afterwards. You can also check how the aggregate results have changed over time.
The 30 most recent results are retained, and any older results are discarded.
Selectable aggregation intervals and the notification timing
The Periodic reports feature allows you to select any of the following intervals for logging aggregate results.
- Hourly
- Daily
- Weekly
- Monthly
- Quarterly
- Yearly
When a periodic report is generated, a notification is sent to the user who set up periodic reports.
If the app fails to generate a periodic report, a notification is sent to all users who have the management permission for the app.
Notes on setting up periodic reports
The following are the points to note regarding periodic reports.
- Once you set up periodic reports of a chart, you will not be able to edit or duplicate the chart. Also, you will not be able to change the interval for generating reports. If you need a backup of the chart setting, duplicate the chart before setting up its periodic reports.
- Records and fields subject to data aggregation of periodic reports are only those that can be viewed by the user who set up periodic reports.
- Users other than the one who set up periodic reports can view generated reports even if they do not have permission to view records that are subject to data aggregation. However, if these users do not have permission to view fields that are subject to data aggregation, they cannot view generated reports.
- If the chart is deleted, all of its periodic reports recorded up until then are deleted and will be unavailable.
- If you have selected Pivot table for the chart type, it is not possible to set up periodic reports.
Setting up periodic reports
"Periodic reports" is one of the setting options in the chart settings. This section describes the procedure for setting up periodic reports for an existing chart.
-
Click the App settings icon (the gear-shaped icon) at the upper right of the View screen.

-
On the App settings screen, click the Graphs tab.
-
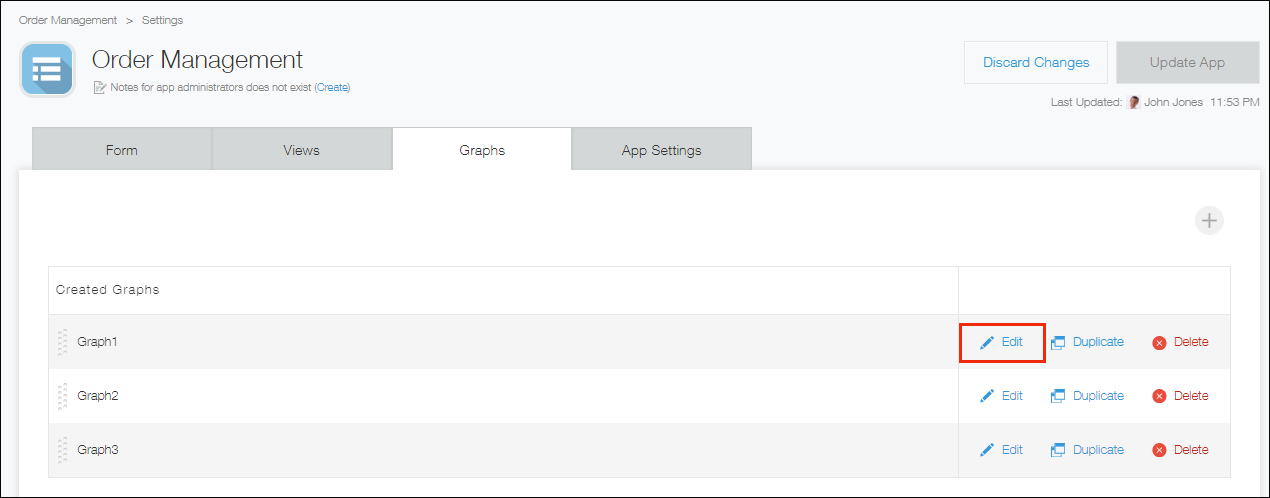
Click the Edit button next to the chart for which you want to set up periodic reports.
-
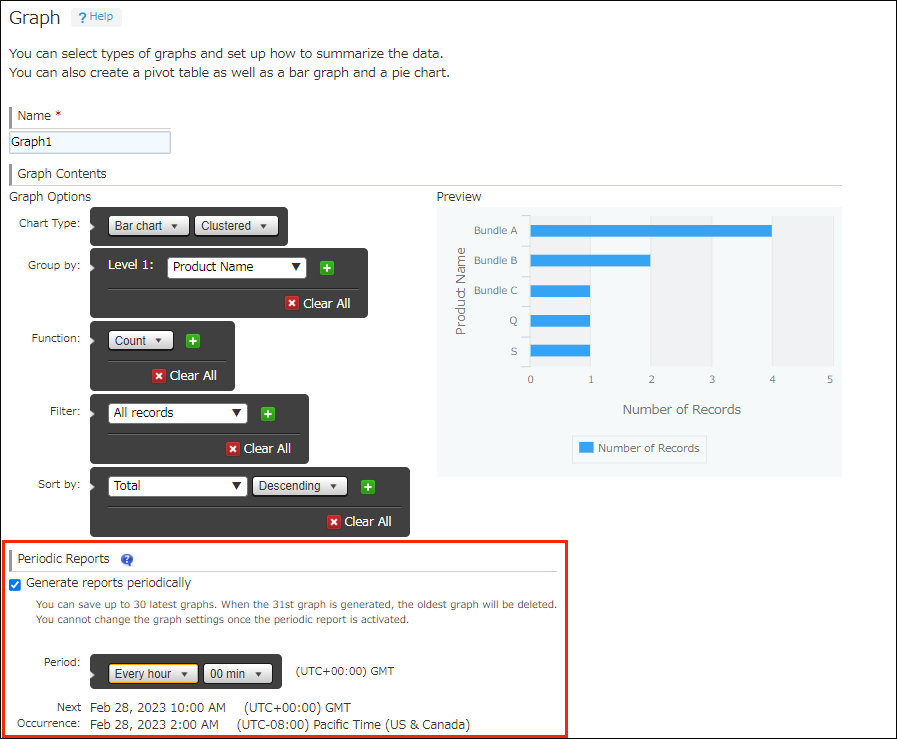
In the Periodic reports section on the Graph screen, select the Generate reports periodically check box.
-
Specify the interval for generating reports.
-
Click Save at the bottom right of the screen.
-
On the App settings screen, click Update app.
-
On the Update app dialog, click Update app.
Checking aggregate results in periodic reports
-
On the View screen, click the Graph icon.

-
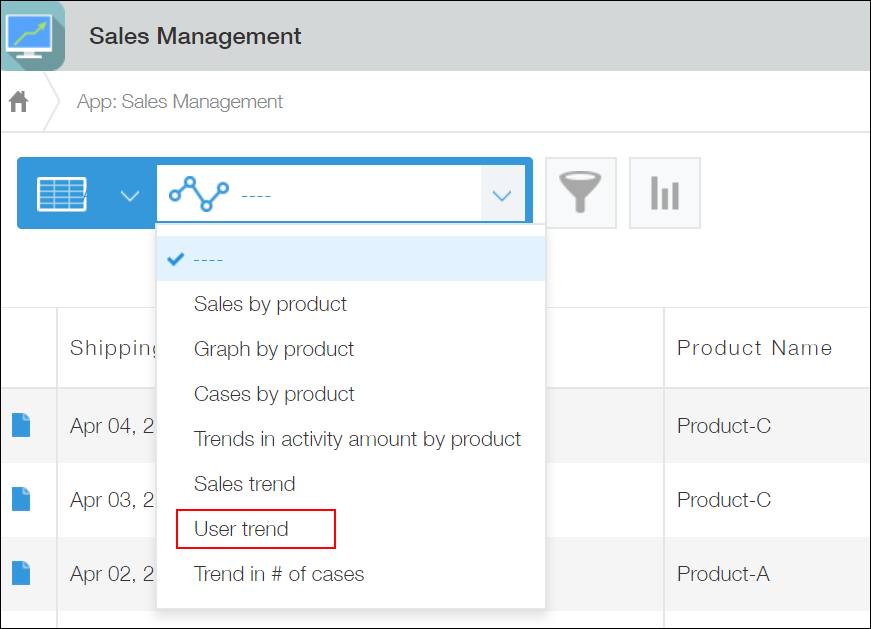
Choose the chart for which you want to view periodic reports.
-
Select a chart type and generated date on the chart screen.
- To check the aggregate result logged at a specific point in time, select a chart type and generated date.
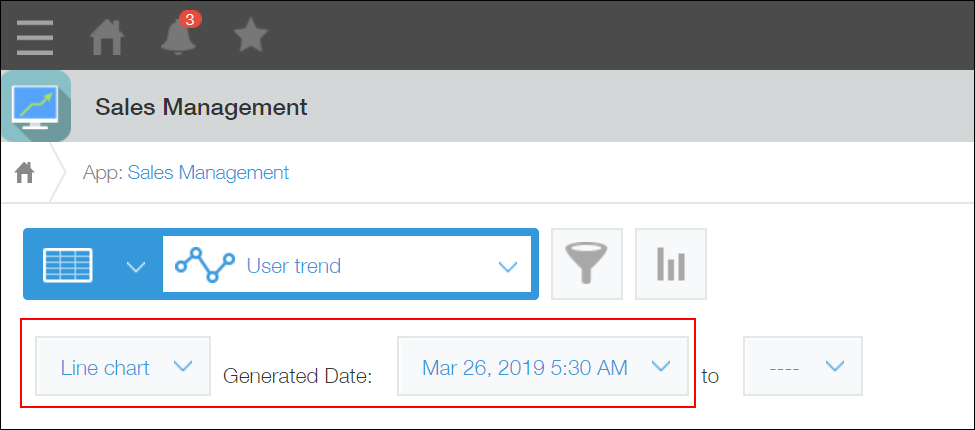
- To check how the aggregate results changed during a certain time period, specify a period.
If you specify a period, a line chart is displayed regardless of the chart type you have selected.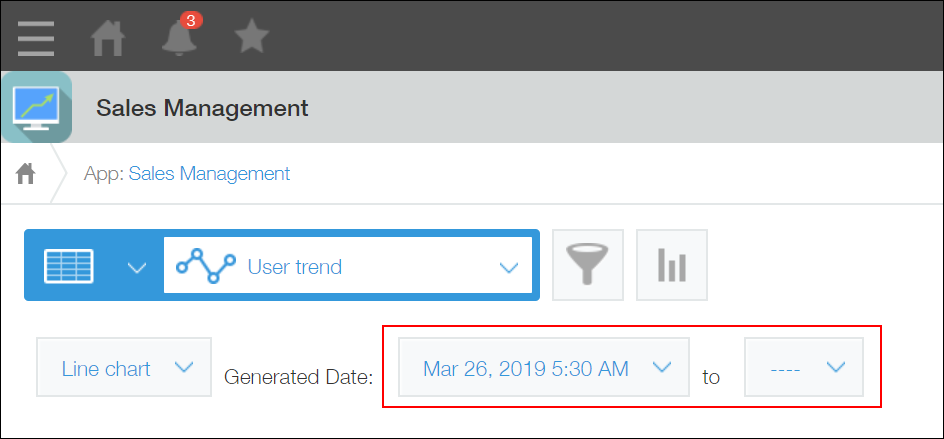
- To check the aggregate result logged at a specific point in time, select a chart type and generated date.
This will display the aggregate results logged by the Periodic Reports feature.
Deactivating periodic reports
When you deactivate periodic reports, the app stops generating periodic reports.
- Aggregate results logged in the past can be viewed even when the feature is inactive.
- The feature can be reactivated at any time after it has been deactivated.
- No aggregate data is recorded while the feature is inactive, so you cannot access results for that period even after reactivation.
The following are the steps to deactivate periodic reports.
-
Click the App settings icon (the gear-shaped icon) at the upper right of the View screen.

-
On the App settings screen, click the Graphs tab.
-
Click the Edit button next to the chart for which you want to disable periodic reports.
-
Select Inactive in the Periodic reports section on the Graph screen.
-
Click Save at the bottom right of the screen.
-
On the App settings screen, click Update app.
-
On the Update app dialog, click Update app.
If you want to reactivate periodic reports, select Active in the Periodic reports section on the Graph screen.
